Matplotlib-cpp implementation of the Plotter interface.
More...
#include <MatplotlibPlotter.h>
|
| virtual | ~MatplotlibPlotter ()=default |
| |
| void | plot2D (const std::vector< double > &xData, const std::vector< double > &yData, const std::string &title, const std::string &xLabel, const std::string &yLabel) override |
| | Plot a 2D line graph.
|
| |
| void | addMarker (double xValue, const std::string &label) override |
| | Add a vertical marker at a specific x-axis value.
|
| |
| void | plotPosVelAcc (const std::vector< double > &time, const std::vector< double > &altitude, const std::vector< double > &velocity, const std::vector< double > &acceleration) override |
| | Plot altitude, velocity, and acceleration together on a single canvas.
|
| |
| virtual | ~Plotter ()=default |
| |
|
| std::vector< std::pair< double, std::string > > | markers_ |
| |
Matplotlib-cpp implementation of the Plotter interface.
◆ ~MatplotlibPlotter()
| virtual MatplotlibPlotter::~MatplotlibPlotter |
( |
| ) |
|
|
virtualdefault |
◆ addMarker()
| void MatplotlibPlotter::addMarker |
( |
double | xValue, |
|
|
const std::string & | label ) |
|
inlineoverridevirtual |
Add a vertical marker at a specific x-axis value.
- Parameters
-
| xValue | The x position (e.g., time in seconds) |
| label | Text label to display near the marker |
Implements Plotter.
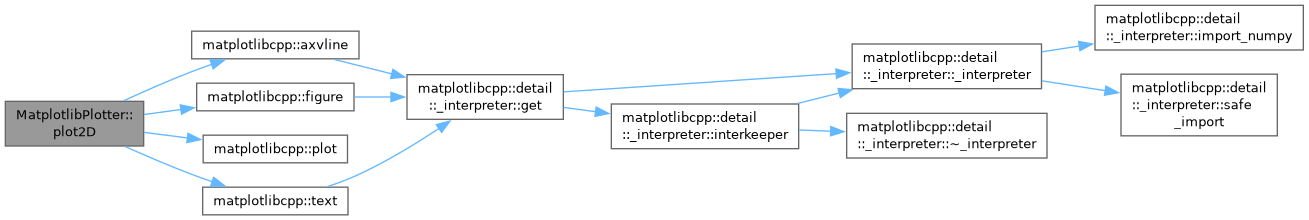
◆ plot2D()
| void MatplotlibPlotter::plot2D |
( |
const std::vector< double > & | xData, |
|
|
const std::vector< double > & | yData, |
|
|
const std::string & | title, |
|
|
const std::string & | xLabel, |
|
|
const std::string & | yLabel ) |
|
inlineoverridevirtual |
Plot a 2D line graph.
- Parameters
-
| xData | Vector of x-axis values (e.g., time) |
| yData | Vector of y-axis values (e.g., altitude) |
| title | Plot title |
| xLabel | Label for x-axis |
| yLabel | Label for y-axis |
Implements Plotter.
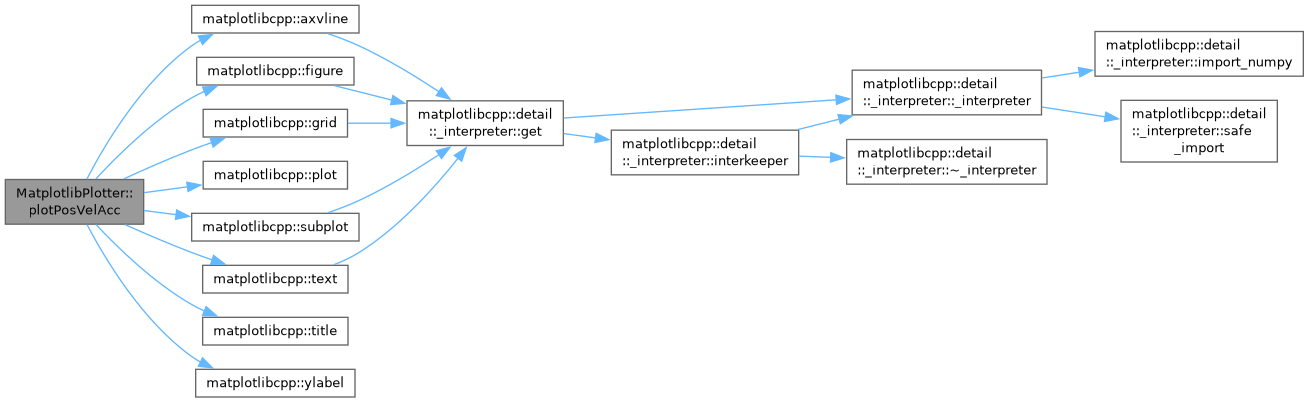
◆ plotPosVelAcc()
| void MatplotlibPlotter::plotPosVelAcc |
( |
const std::vector< double > & | time, |
|
|
const std::vector< double > & | altitude, |
|
|
const std::vector< double > & | velocity, |
|
|
const std::vector< double > & | acceleration ) |
|
inlineoverridevirtual |
Plot altitude, velocity, and acceleration together on a single canvas.
- Parameters
-
| time | Time points |
| altitude | Altitude (Z position) |
| velocity | Vertical velocity |
| acceleration | Vertical acceleration |
Implements Plotter.
◆ markers_
| std::vector<std::pair<double, std::string> > MatplotlibPlotter::markers_ |
|
private |
The documentation for this class was generated from the following file:


 Public Member Functions inherited from Plotter