|
| void | backend (const std::string &name) |
| |
| bool | annotate (std::string annotation, double x, double y) |
| |
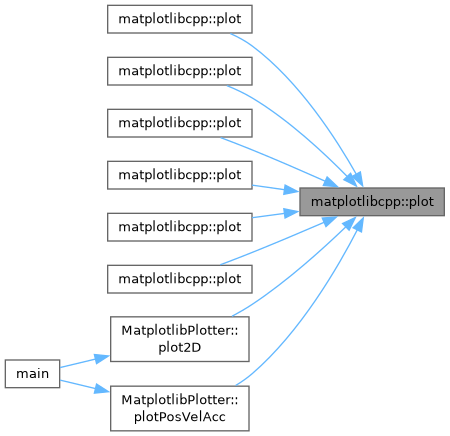
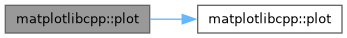
| template<typename Numeric> |
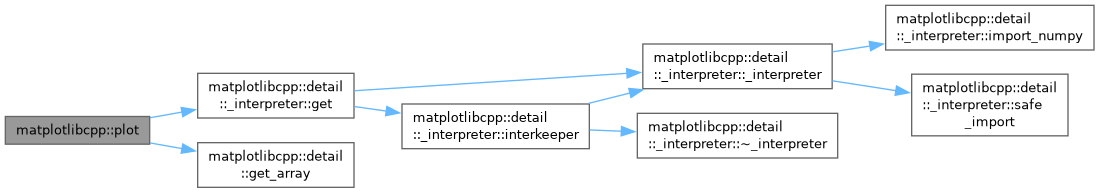
| bool | plot (const std::vector< Numeric > &x, const std::vector< Numeric > &y, const std::map< std::string, std::string > &keywords) |
| |
| template<typename Numeric> |
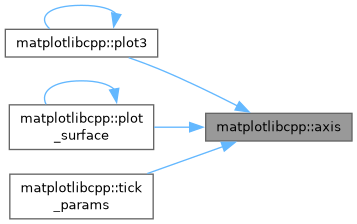
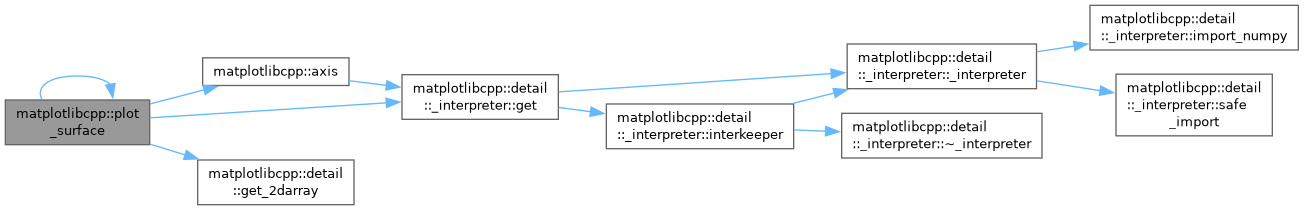
| void | plot_surface (const std::vector<::std::vector< Numeric > > &x, const std::vector<::std::vector< Numeric > > &y, const std::vector<::std::vector< Numeric > > &z, const std::map< std::string, std::string > &keywords=std::map< std::string, std::string >(), const long fig_number=0) |
| |
| template<typename Numeric> |
| void | contour (const std::vector<::std::vector< Numeric > > &x, const std::vector<::std::vector< Numeric > > &y, const std::vector<::std::vector< Numeric > > &z, const std::map< std::string, std::string > &keywords={}) |
| |
| template<typename Numeric> |
| void | spy (const std::vector<::std::vector< Numeric > > &x, const double markersize=-1, const std::map< std::string, std::string > &keywords={}) |
| |
| template<typename Numeric> |
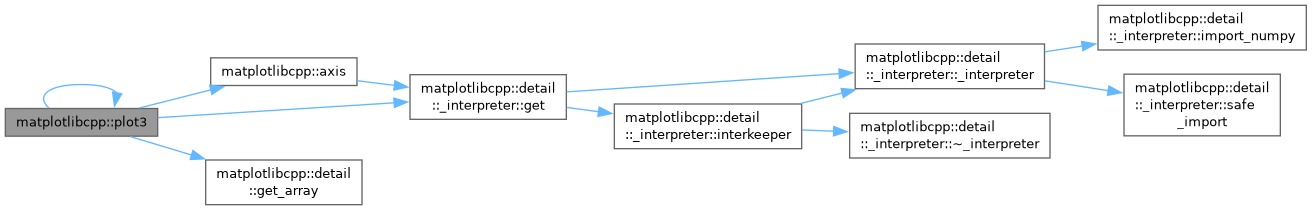
| void | plot3 (const std::vector< Numeric > &x, const std::vector< Numeric > &y, const std::vector< Numeric > &z, const std::map< std::string, std::string > &keywords=std::map< std::string, std::string >(), const long fig_number=0) |
| |
| template<typename Numeric> |
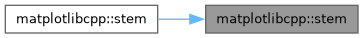
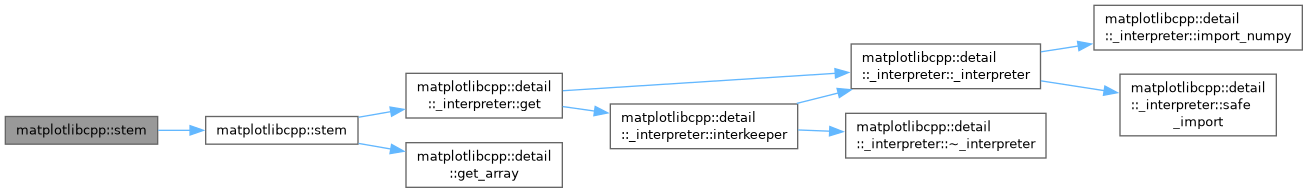
| bool | stem (const std::vector< Numeric > &x, const std::vector< Numeric > &y, const std::map< std::string, std::string > &keywords) |
| |
| template<typename Numeric> |
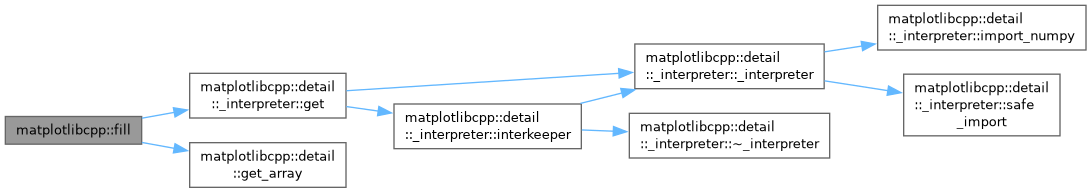
| bool | fill (const std::vector< Numeric > &x, const std::vector< Numeric > &y, const std::map< std::string, std::string > &keywords) |
| |
| template<typename Numeric> |
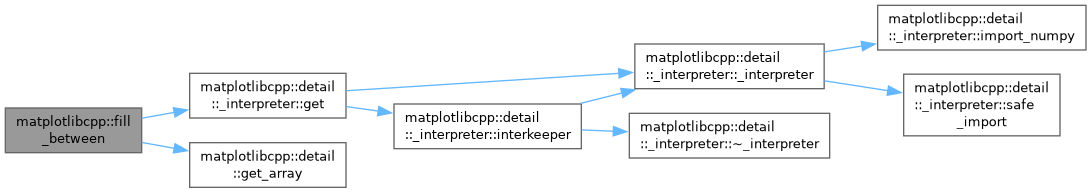
| bool | fill_between (const std::vector< Numeric > &x, const std::vector< Numeric > &y1, const std::vector< Numeric > &y2, const std::map< std::string, std::string > &keywords) |
| |
| template<typename Numeric> |
| bool | arrow (Numeric x, Numeric y, Numeric end_x, Numeric end_y, const std::string &fc="r", const std::string ec="k", Numeric head_length=0.25, Numeric head_width=0.1625) |
| |
| template<typename Numeric> |
| bool | hist (const std::vector< Numeric > &y, long bins=10, std::string color="b", double alpha=1.0, bool cumulative=false) |
| |
| void | imshow (const unsigned char *ptr, const int rows, const int columns, const int colors, const std::map< std::string, std::string > &keywords={}, PyObject **out=nullptr) |
| |
| void | imshow (const float *ptr, const int rows, const int columns, const int colors, const std::map< std::string, std::string > &keywords={}, PyObject **out=nullptr) |
| |
| template<typename NumericX, typename NumericY> |
| bool | scatter (const std::vector< NumericX > &x, const std::vector< NumericY > &y, const double s=1.0, const std::map< std::string, std::string > &keywords={}) |
| |
| template<typename NumericX, typename NumericY, typename NumericColors> |
| bool | scatter_colored (const std::vector< NumericX > &x, const std::vector< NumericY > &y, const std::vector< NumericColors > &colors, const double s=1.0, const std::map< std::string, std::string > &keywords={}) |
| |
| template<typename NumericX, typename NumericY, typename NumericZ> |
| bool | scatter (const std::vector< NumericX > &x, const std::vector< NumericY > &y, const std::vector< NumericZ > &z, const double s=1.0, const std::map< std::string, std::string > &keywords={}, const long fig_number=0) |
| |
| template<typename Numeric> |
| bool | boxplot (const std::vector< std::vector< Numeric > > &data, const std::vector< std::string > &labels={}, const std::map< std::string, std::string > &keywords={}) |
| |
| template<typename Numeric> |
| bool | boxplot (const std::vector< Numeric > &data, const std::map< std::string, std::string > &keywords={}) |
| |
| template<typename Numeric> |
| bool | bar (const std::vector< Numeric > &x, const std::vector< Numeric > &y, std::string ec="black", std::string ls="-", double lw=1.0, const std::map< std::string, std::string > &keywords={}) |
| |
| template<typename Numeric> |
| bool | bar (const std::vector< Numeric > &y, std::string ec="black", std::string ls="-", double lw=1.0, const std::map< std::string, std::string > &keywords={}) |
| |
| template<typename Numeric> |
| bool | barh (const std::vector< Numeric > &x, const std::vector< Numeric > &y, std::string ec="black", std::string ls="-", double lw=1.0, const std::map< std::string, std::string > &keywords={ }) |
| |
| bool | subplots_adjust (const std::map< std::string, double > &keywords={}) |
| |
| template<typename Numeric> |
| bool | named_hist (std::string label, const std::vector< Numeric > &y, long bins=10, std::string color="b", double alpha=1.0) |
| |
| template<typename NumericX, typename NumericY> |
| bool | plot (const std::vector< NumericX > &x, const std::vector< NumericY > &y, const std::string &s="") |
| |
| template<typename NumericX, typename NumericY, typename NumericZ> |
| bool | contour (const std::vector< NumericX > &x, const std::vector< NumericY > &y, const std::vector< NumericZ > &z, const std::map< std::string, std::string > &keywords={}) |
| |
| template<typename NumericX, typename NumericY, typename NumericU, typename NumericW> |
| bool | quiver (const std::vector< NumericX > &x, const std::vector< NumericY > &y, const std::vector< NumericU > &u, const std::vector< NumericW > &w, const std::map< std::string, std::string > &keywords={}) |
| |
| template<typename NumericX, typename NumericY, typename NumericZ, typename NumericU, typename NumericW, typename NumericV> |
| bool | quiver (const std::vector< NumericX > &x, const std::vector< NumericY > &y, const std::vector< NumericZ > &z, const std::vector< NumericU > &u, const std::vector< NumericW > &w, const std::vector< NumericV > &v, const std::map< std::string, std::string > &keywords={}) |
| |
| template<typename NumericX, typename NumericY> |
| bool | stem (const std::vector< NumericX > &x, const std::vector< NumericY > &y, const std::string &s="") |
| |
| template<typename NumericX, typename NumericY> |
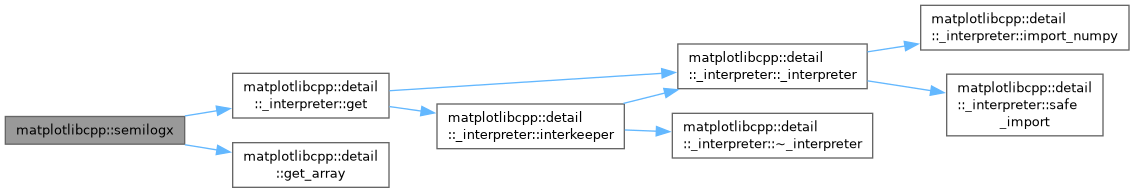
| bool | semilogx (const std::vector< NumericX > &x, const std::vector< NumericY > &y, const std::string &s="") |
| |
| template<typename NumericX, typename NumericY> |
| bool | semilogy (const std::vector< NumericX > &x, const std::vector< NumericY > &y, const std::string &s="") |
| |
| template<typename NumericX, typename NumericY> |
| bool | loglog (const std::vector< NumericX > &x, const std::vector< NumericY > &y, const std::string &s="") |
| |
| template<typename NumericX, typename NumericY> |
| bool | errorbar (const std::vector< NumericX > &x, const std::vector< NumericY > &y, const std::vector< NumericX > &yerr, const std::map< std::string, std::string > &keywords={}) |
| |
| template<typename Numeric> |
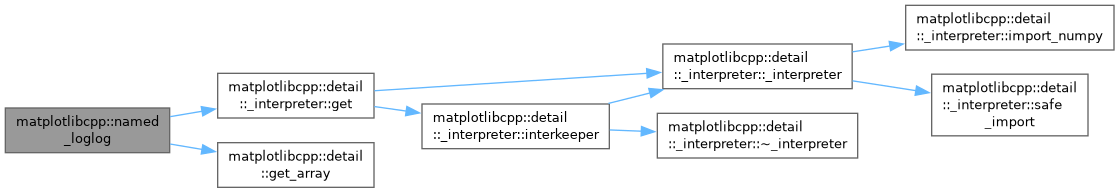
| bool | named_plot (const std::string &name, const std::vector< Numeric > &y, const std::string &format="") |
| |
| template<typename NumericX, typename NumericY> |
| bool | named_plot (const std::string &name, const std::vector< NumericX > &x, const std::vector< NumericY > &y, const std::string &format="") |
| |
| template<typename NumericX, typename NumericY> |
| bool | named_semilogx (const std::string &name, const std::vector< NumericX > &x, const std::vector< NumericY > &y, const std::string &format="") |
| |
| template<typename NumericX, typename NumericY> |
| bool | named_semilogy (const std::string &name, const std::vector< NumericX > &x, const std::vector< NumericY > &y, const std::string &format="") |
| |
| template<typename NumericX, typename NumericY> |
| bool | named_loglog (const std::string &name, const std::vector< NumericX > &x, const std::vector< NumericY > &y, const std::string &format="") |
| |
| template<typename Numeric> |
| bool | plot (const std::vector< Numeric > &y, const std::string &format="") |
| |
| template<typename Numeric> |
| bool | plot (const std::vector< Numeric > &y, const std::map< std::string, std::string > &keywords) |
| |
| template<typename Numeric> |
| bool | stem (const std::vector< Numeric > &y, const std::string &format="") |
| |
| template<typename Numeric> |
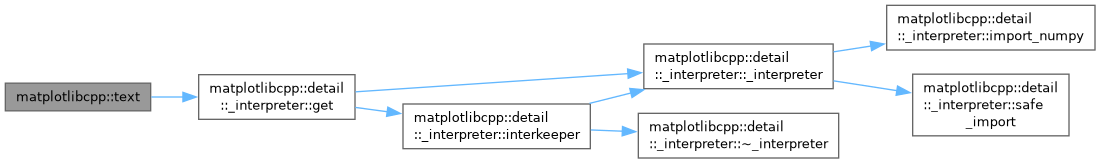
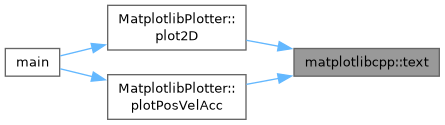
| void | text (Numeric x, Numeric y, const std::string &s="") |
| |
| void | colorbar (PyObject *mappable=NULL, const std::map< std::string, float > &keywords={}) |
| |
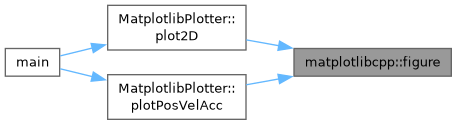
| long | figure (long number=-1) |
| |
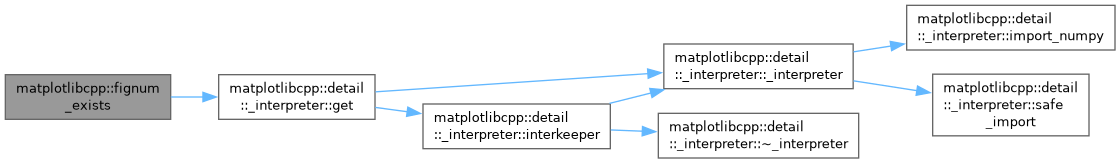
| bool | fignum_exists (long number) |
| |
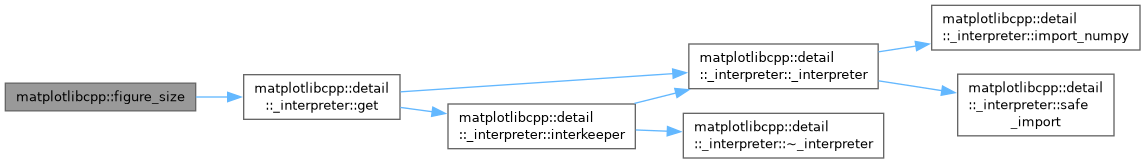
| void | figure_size (size_t w, size_t h) |
| |
| void | legend () |
| |
| void | legend (const std::map< std::string, std::string > &keywords) |
| |
| template<typename Numeric> |
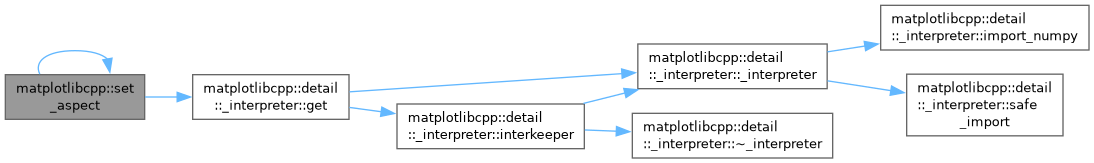
| void | set_aspect (Numeric ratio) |
| |
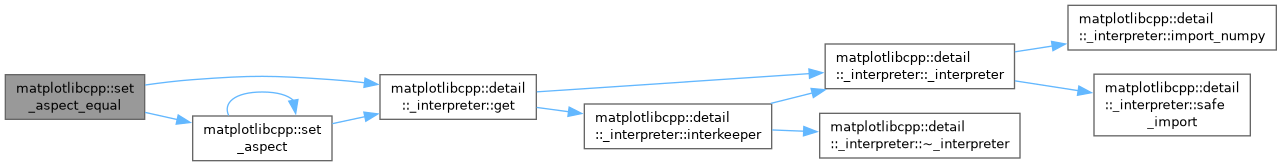
| void | set_aspect_equal () |
| |
| template<typename Numeric> |
| void | ylim (Numeric left, Numeric right) |
| |
| template<typename Numeric> |
| void | xlim (Numeric left, Numeric right) |
| |
| std::array< double, 2 > | xlim () |
| |
| std::array< double, 2 > | ylim () |
| |
| template<typename Numeric> |
| void | xticks (const std::vector< Numeric > &ticks, const std::vector< std::string > &labels={}, const std::map< std::string, std::string > &keywords={}) |
| |
| template<typename Numeric> |
| void | xticks (const std::vector< Numeric > &ticks, const std::map< std::string, std::string > &keywords) |
| |
| template<typename Numeric> |
| void | yticks (const std::vector< Numeric > &ticks, const std::vector< std::string > &labels={}, const std::map< std::string, std::string > &keywords={}) |
| |
| template<typename Numeric> |
| void | yticks (const std::vector< Numeric > &ticks, const std::map< std::string, std::string > &keywords) |
| |
| template<typename Numeric> |
| void | margins (Numeric margin) |
| |
| template<typename Numeric> |
| void | margins (Numeric margin_x, Numeric margin_y) |
| |
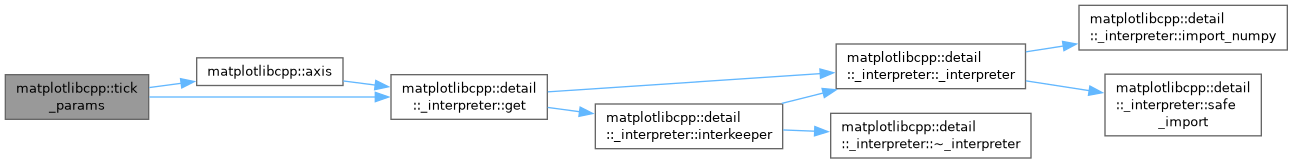
| void | tick_params (const std::map< std::string, std::string > &keywords, const std::string axis="both") |
| |
| void | subplot (long nrows, long ncols, long plot_number) |
| |
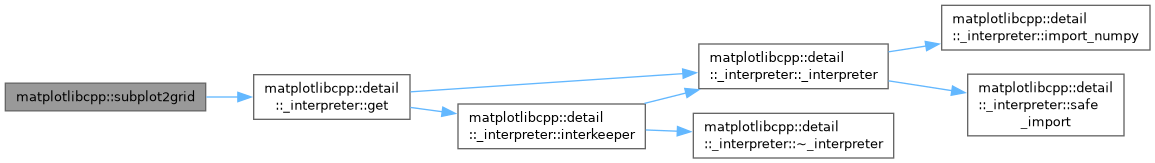
| void | subplot2grid (long nrows, long ncols, long rowid=0, long colid=0, long rowspan=1, long colspan=1) |
| |
| void | title (const std::string &titlestr, const std::map< std::string, std::string > &keywords={}) |
| |
| void | suptitle (const std::string &suptitlestr, const std::map< std::string, std::string > &keywords={}) |
| |
| void | axis (const std::string &axisstr) |
| |
| void | axhline (double y, double xmin=0., double xmax=1., const std::map< std::string, std::string > &keywords=std::map< std::string, std::string >()) |
| |
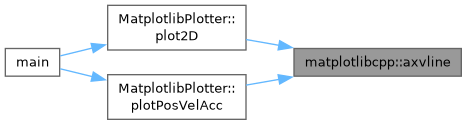
| void | axvline (double x, double ymin=0., double ymax=1., const std::map< std::string, std::string > &keywords=std::map< std::string, std::string >()) |
| |
| void | axvspan (double xmin, double xmax, double ymin=0., double ymax=1., const std::map< std::string, std::string > &keywords=std::map< std::string, std::string >()) |
| |
| void | xlabel (const std::string &str, const std::map< std::string, std::string > &keywords={}) |
| |
| void | ylabel (const std::string &str, const std::map< std::string, std::string > &keywords={}) |
| |
| void | set_zlabel (const std::string &str, const std::map< std::string, std::string > &keywords={}) |
| |
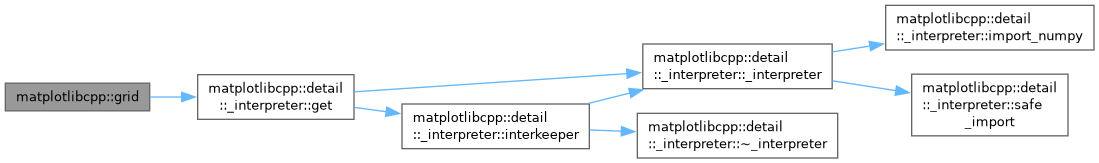
| void | grid (bool flag) |
| |
| void | show (const bool block=true) |
| |
| void | close () |
| |
| void | xkcd () |
| |
| void | draw () |
| |
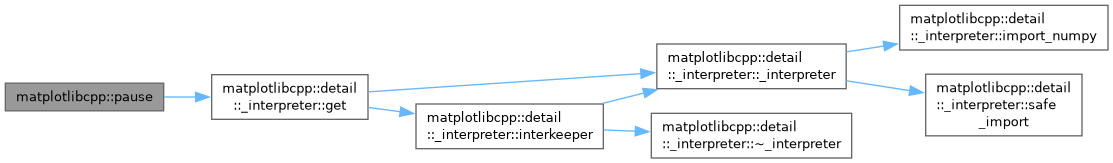
| template<typename Numeric> |
| void | pause (Numeric interval) |
| |
| void | save (const std::string &filename, const int dpi=0) |
| |
| void | rcparams (const std::map< std::string, std::string > &keywords={}) |
| |
| void | clf () |
| |
| void | cla () |
| |
| void | ion () |
| |
| std::vector< std::array< double, 2 > > | ginput (const int numClicks=1, const std::map< std::string, std::string > &keywords={}) |
| |
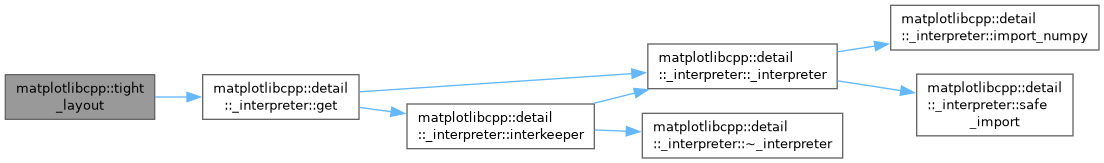
| void | tight_layout () |
| |
| template<typename... Args> |
| bool | plot () |
| |
| template<typename A, typename B, typename... Args> |
| bool | plot (const A &a, const B &b, const std::string &format, Args... args) |
| |
| bool | plot (const std::vector< double > &x, const std::vector< double > &y, const std::string &format="") |
| |
| bool | plot (const std::vector< double > &y, const std::string &format="") |
| |
| bool | plot (const std::vector< double > &x, const std::vector< double > &y, const std::map< std::string, std::string > &keywords) |
| |